
Capacity Is Not Performance
Cooling system specifications focus on capacity: BTUs per hour, tons of refrigeration, CFM ratings. Design engineers size equipment to meet calculated loads with safety margins. Equipment manufacturers certify performance under controlled test conditions.
Field performance tells a different story. Facilities with adequate—even excessive—installed cooling capacity routinely experience hot spots, thermal complaints, and equipment operating outside recommended temperature ranges. The gap between rated capacity and delivered performance is almost entirely an airflow distribution problem.
The ASHRAE Thermal Envelope
ASHRAE Technical Committee 9.9 publishes thermal guidelines for data processing environments—the most thermally demanding buildings in operation. The 2021 fifth edition establishes temperature ranges that apply across equipment classes:¹
Recommended envelope (all classes):
- Temperature: 18-27°C (64.4-80.6°F)
- Humidity: Dew point -9°C to 15°C, maximum 60% RH
Allowable ranges by equipment class:
| Class | Temperature Range | Application |
|---|---|---|
| A1 | 15-32°C (59-89.6°F) | Enterprise servers |
| A2 | 10-35°C (50-95°F) | Volume servers |
| A3 | 5-40°C (41-104°F) | Extended temperature |
| A4 | 5-45°C (41-113°F) | Maximum flexibility |
| H1 | Recommended 18-22°C (64.4-71.6°F), Allowable upper 25°C (77°F) | High-density AI/HPC |
Source: ASHRAE TC 9.9 Thermal Guidelines, 5th Edition¹
The H1 class, added for AI and high-performance computing workloads, has the narrowest recommended range—recognition that high-density compute is thermally unforgiving.
Operating within the recommended range is not merely a reliability consideration. Server failure rates approximately double for every 10°C increase above recommended inlet temperature.¹ The economic impact extends beyond equipment replacement to include lost compute time, data recovery, and the operational disruption of unplanned outages.
The Industry Average Problem
Uptime Institute’s Global Data Center Survey tracks Power Usage Effectiveness (PUE)—the ratio of total facility power to IT equipment power. A PUE of 2.0 means the facility uses 1 watt of overhead (cooling, lighting, power distribution losses) for every 1 watt of compute. A PUE of 1.0 would mean zero overhead—a theoretical limit.
The industry average PUE has stalled:²
| Year | Average PUE |
|---|---|
| 2007 | 2.5 |
| 2011 | 1.98 |
| 2014 | 1.65 |
| 2020-2024 | 1.55-1.59 |
The improvement curve has flattened. Average PUE has been stuck in the 1.55-1.59 band since 2020.² Meanwhile, best-in-class facilities achieve 1.04-1.10—demonstrating that the technology exists to do far better than average.
New builds consistently report PUE of 1.3 or better. Facilities built in the past five years average approximately 1.45. The gap between new construction and legacy facilities suggests that airflow management improvements, not just equipment upgrades, drive the difference.
Cooling as Percentage of Total Power
Cooling accounts for approximately 40% of total data center energy consumption.³ The range spans 30-55% depending on facility design and cooling technology.⁴ Best-in-class facilities have reduced cooling to as low as 7% of total energy.⁵
This variance is the opportunity. A facility spending 40% of its energy budget on cooling could, with proper airflow management, reduce that to 20% or less—freeing electrical and thermal capacity for additional compute without infrastructure expansion.
The Bypass Airflow Problem
Upsite Technologies has studied airflow management across 45 data centers worldwide. Their findings quantify the waste:⁶
- Average cooling overcapacity: 3.9x more cooling capacity installed than the IT load requires
- Bypass airflow waste: Approximately 60% of available cooling never reaches IT equipment
- Misdirected air: 48% of conditioned air fails to reach equipment inlets due to unsealed floor openings
- Proper tile placement: Only 6 of 45 sites (13%) had correctly positioned every perforated floor tile
Bypass airflow is conditioned air that returns to cooling units without passing through IT equipment. It performs no useful cooling. Every CFM of bypass air represents wasted fan energy in the cooling unit and wasted compressor energy generating the cold air in the first place.
The 3.9x overcapacity figure deserves emphasis. Facilities are installing nearly four times the cooling equipment they need because they cannot deliver the cooling they have to the equipment that needs it.
The Two Mechanisms
Hot spots in adequately cooled facilities trace to two airflow failure modes:⁷
Bypass airflow: Conditioned air escapes through cable cutouts, unsealed floor tiles, gaps between cabinets, and openings in containment structures. This air short-circuits directly back to cooling unit returns without cooling any equipment.
Recirculation: Hot exhaust air from equipment rear or top recirculates to equipment inlets, mixing with cold supply air and raising inlet temperatures. Recirculation can create inlet temperatures 10-15°F higher than supply air temperature within a single cabinet row.
Both mechanisms can occur simultaneously. A poorly sealed raised floor allows cold air to bypass; the resulting pressure imbalance draws hot exhaust air into cold aisles. The facility has adequate cooling capacity but delivers it to the wrong locations.
Containment Effectiveness
Hot aisle/cold aisle layout—alternating cabinet orientations so all fronts face cold aisles and all rears face hot aisles—provides 10-35% cooling savings compared to unorganized layouts.⁸
Cold Aisle Containment (CAC) encloses the cold aisle with doors and ceiling panels. LBNL research found that CAC can reduce the electricity used to move cold supply air by 75%.⁷
Hot Aisle Containment (HAC) encloses the hot aisle instead. Schneider Electric’s analysis found that at a 75°F work environment setpoint, HAC consumes 40% less cooling energy than CAC and saves 43% in annual cooling energy costs.⁹ This corresponds to a 15% reduction in annualized PUE.⁹
The HAC advantage stems from economizer utilization. By allowing the ambient environment to warm (exhaust air is contained and ducted to returns), HAC increases the number of hours per year when outside air can be used for cooling without mechanical refrigeration.
Blanking Panel Impact
The simplest airflow intervention—installing blanking panels in empty rack positions—produces measurable results:
| Metric | Value | Source |
|---|---|---|
| Server inlet temperature reduction | 7°F (3.9°C) average | Upsite Technologies¹⁰ |
| Single 1U panel temperature impact | Up to 20°F rack intake reduction | EDP Europe¹¹ |
| Single 1-foot panel energy savings | ~1-2% cooling energy | Upsite Technologies¹⁰ |
| 7°F setpoint increase enabled | ~28% cooling energy savings | Upsite Technologies¹⁰ |
| Large facility annual savings (grommets + panels) | Up to $360,000 | Upsite Technologies¹⁰ |
| Containment + panels combined | 20%+ energy savings | Eziblank¹² |
A blanking panel costs $5-15. A complete set for a 42U rack might cost $200. The payback period, measured in energy savings and avoided hot spot remediation, is typically weeks.
Case Studies
Global financial services firm: Reduced PUE from 2.3 to 1.49—a 34% improvement—through energy assessment, temperature surveys, air management improvements, and increased temperature setpoints enabled by better airflow control.¹³
DOE Federal High-Performance Computing: Six DOD data centers achieved over 8,000 MWh in annual energy savings and $1 million in annual cost savings through airflow management and temperature optimization. Average payback period was less than two years.¹⁴
Meta Prineville, Oregon: Operates year-round without mechanical cooling at PUE 1.15, even when summer temperatures reach 110°F. Evaporative cooling and careful airflow management deliver comfort cooling for the IT load without chillers.
The Diagnostic Framework
Identifying airflow problems requires measurement, not assumption:
Temperature mapping: Inlet temperature at every rack position, measured under representative load conditions. Hot spots are immediately visible.
Differential pressure: Pressure difference between supply plenum (under raised floor) and room ambient. Low or negative differential indicates leakage.
CFD modeling: Computational Fluid Dynamics simulation predicts airflow patterns before physical changes are made, reducing trial-and-error.
Thermal imaging: Infrared cameras visualize recirculation patterns and bypass paths that are invisible to the naked eye.
Evaporative Media Integration
Phoenix Manufacturing’s evaporative media products serve air-side economizer applications. When outside air is cool and dry enough for direct use, evaporative media pre-conditions the air—reducing temperature while adding controlled humidity.
The effectiveness of evaporative media depends directly on airflow distribution. Media that receives uneven airflow develops uneven saturation, reducing effectiveness and accelerating degradation. The airflow management principles that improve mechanical cooling efficiency also improve evaporative cooling performance.
Implications
Cooling capacity is a solved problem. Equipment manufacturers offer chillers, CRAH units, and containment systems capable of handling any realistic heat load. The remaining challenge is distribution: getting cold air to equipment inlets and hot air to returns without mixing or bypass.
The 3.9x overcapacity finding suggests that most facilities could serve their current loads with 25% of their installed cooling capacity—if airflow were optimized. The practical implication is that airflow remediation should precede capacity expansion in any facility experiencing thermal constraints.
For new construction, the design sequence matters: airflow modeling first, then equipment selection. Specifying cooling capacity without understanding distribution patterns produces the 1.56 PUE average. Understanding distribution first produces the 1.04-1.10 results that best-in-class facilities achieve.
Works Cited
- ASHRAE TC 9.9 Thermal Guidelines for Data Processing Environments, 5th Edition, 2021, accessed February 2025, https://www.ashrae.org/file%20library/technical%20resources/bookstore/supplemental%20files/therm-gdlns-5th-r-e-refcard.pdf
- Global PUEs: Are They Going Anywhere?, Uptime Institute, accessed February 2025, https://journal.uptimeinstitute.com/global-pues-are-they-going-anywhere/
- Data Centers and Their Energy Consumption FAQ, Congressional Research Service R48646, accessed February 2025, https://www.congress.gov/crs-product/R48646
- Data Center Cooling Costs, DataSpan, accessed February 2025, https://dataspan.com/blog/data-center-cooling-costs/
- Energy Consumption in Data Centers: Air Versus Liquid Cooling, Boyd Corporation, accessed February 2025, https://www.boydcorp.com/blog/energy-consumption-in-data-centers-air-versus-liquid-cooling.html
- 6 Key Metrics to Optimize Your Data Center’s Cooling, Upsite Technologies, accessed February 2025, https://www.upsite.com/blog/6-key-metrics-to-optimize-your-data-centers-cooling/
- Reducing Bypass Airflow, Upsite Technologies White Paper, accessed February 2025, https://www.upsite.com/resources/white-papers/reducing-bypass-airflow-essential-eliminating-computer-room-hotspots/
- Move to Hot Aisle/Cold Aisle Layout, ENERGY STAR, accessed February 2025, https://www.energystar.gov/products/data_center_equipment/16-more-ways-cut-energy-waste-data-center/move-hot-aislecold-aisle-layout
- Hot-Aisle Beats Cold-Aisle Containment, Schneider Electric Blog, accessed February 2025, https://blog.se.com/datacenter/architecture/2011/09/15/for-data-center-energy-efficiency-hot-aisle-beats-cold-aisle-containment/
- Blanking Panels: Sealing Small Gaps Can Lead to Big Savings, Upsite Technologies, accessed February 2025, https://www.upsite.com/blog/blanking-panels-sealing-small-gaps-can-lead-big-savings/
- Importance of Blanking Panels in Data Centre Cooling, EDP Europe, accessed February 2025, https://www.edpeurope.com/airflow-cooling/blanking-panels-and-their-importance-in-improving-data-centre-cooling/
- Importance of Blanking Panels in Data Centers, Eziblank, accessed February 2025, https://www.eziblank.com/the-importance-of-blanking-panels-in-data-centers-ashrae-best-practices/
- Importance of PUE on Data Center Costs, AKCP, accessed February 2025, https://www.akcp.com/index.php/2024/12/19/importance-of-pue-on-data-center-costs-optimizing-efficiency-and-reducing-expenses/
- Energy Efficiency Opportunities in Federal High Performance Computing Data Centers, DOE FEMP, accessed February 2025, https://www.energy.gov/femp/articles/energy-efficiency-opportunities-federal-high-performance-computing-data-centers
Continue Reading
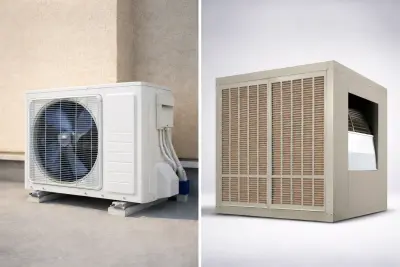
The Real Water Story: Evaporative Cooling Economics
Data-driven analysis of evaporative cooling water consumption, energy savings, and lifecycle cost compared to conventional refrigerant-based systems.

Hewing Hotel: IPS for Historic Luxury
How a 126-year-old, 116,000-square-foot Minneapolis hotel balanced guest comfort, sustainability goals, and HVAC lifecycle cost by selecting Williams’ Integrated Piping System.
Seven Pipes to Two: The Case for Integrated Piping Systems
An analysis of integrated piping systems that replace conventional multi-pipe configurations, reducing installation complexity and lifetime maintenance costs.
Stay Informed
New reports, delivered. Short, factual, and field-tested.